Educational Pathway Dashboard
A 360 View to track Outcomes

Gaining insights into the Student Life Cycle
Educational institute today often spend a lot of time analyzing trends and indicators gleamed from internal and external databases. Often the wide distribution and disparity between the underlying data sets, and the inability to see “how things flow” makes it difficult to obtain inferences or isolate areas that need to be improved.
A Pathway based approach organizes data into a connected flow, so that management and educators alike always have a 360′ view of all relevant information surrounding a particular analyses. For example, when looking at the performance of a particular course, the course coordinator can simultaneously discover whether the same students who poorly in one course, perform well in another and vice versa.
The method yields clarity as it allows management to perform root cause analysis in a simple and intuitive way.
In order to obtain a complete and contiguous picture of organization performance, it is important to monitor the pathways that exist “upstream”, “in process” and “downstream” to the institute namely :
Entrance Pathway
the profile of student seeking admission to the institute
Academic Pathway
the set of processes, assessments and human capital expounded during the students time in the institue
Outcomes Pathway
the outcome of student after leaving the institute in terms of further education or career progresion
The data to support the analysis is obtained from the applications that reside in an institute such as the Student Administration System, the Library System, the Financial Management System as well as other external data such as Graduate Surveys, employment statistics and specialized performance databases.
KMS’s Education Pathway Application powered by QlikView, a leading business intelligence platform, has the unique capability to be able to organise data and information resident both internal and external to the institute into a holistic” Student Life Cycle” approach, that gives superior insight into past, current and future performance.
ADMISSION PATHWAY

The Admission Pathway analyzes prospective applicants to the school or institute. The data source can include not only the results of prospective applicants to the institute but the results of applicants to competing institutes so as to enable the management to have a view of how the institute is performing both in terms of the applicants it receives as well as comparatively with respect to other institutions.
Analysis of this pathway serves both immediate needs in terms of capacity planning but also drives long term strategic decision making, as the institute may decide to increase or decrease the resources allocated to certain courses in line with the projected demand.
The Admissions Pathway is also useful as it provides a context to interpret other downstream analyses such as academic performance and career progression. Is the institute capable of turning average students into high achievers? By linking outcomes to inputs, such answers can be obtained.
ANALYTICAL AREAS
Input Analysis
Analyzing the profile of prospective applicants across faculties and against historical trends
Competitive Position Analysis
Analyzing applicants profile vis-a-vis the profile of the profile of applicants to other institutes
Capacity Analysis
Analyzing the breakdown of places to the number of applications and teaching resources available
Marketing Analysis
Analyzing the effectiveness of marketing campaigns targeted at specific feeder schools and institutes and whether or not it has resulted in the desired effect
Breakout Analysis
Analyzing courses that are suddenly attracting high caliber students
Demographic Analysis
Analyzing the applicant pool in terms of demographics and other cultural specific factors
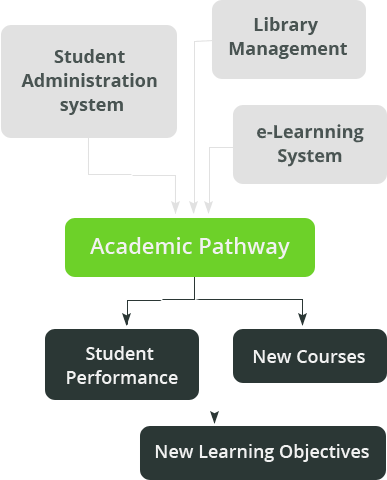
ACADEMIC PATHWAY
The Academic Pathway links the various data captured by the different lines of business application, such as the Student Administration System, the e-Learning system and the Library Management System into a single view.
Analyses can be developed to profile overall performance of students, track drop out rates, deliver more targeted and focused learning objectives and offer new courses in line with market and students interest.
The analytical domains can be further refined to have cluster specific areas as defined by course coordinators.
OUTCOMES PATHWAY
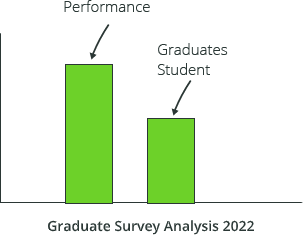
Outcomes data is usually captured via Graduate Survey Analysis. By keeping records, academic staff are able to track the performance of graduates from their institutions in terms of career progression, salaries as well as routes to further education.
The information captured via the Graduate Survey Analysis can serve for retrospective analysis as academicians uncover key drivers that have helped shape student performance once they have left the institute.
Analyses can be compared against industry norms and employment trends to see the position of the of the institute’s graduates vis-a-vis the market as a whole.
ANALYTICAL AREAS
Progression Analysis
Analyzing the progression of a particular batch of students within the institute against industry norms
Workload Analysis
Analyzing student and staff workload to ensure it is balanced and that time tables are adequately spaced apart.
Career Pathways
Analyzing pathways that “over perform” and link it to the processes delivered within the institute
Ranking Analysis
Analyze the contributors to an institute’s ranking and how to adjust levers to achieve the desired outcome
Financial Analysis
Analyzing the operational cost vs. budget of an institute and how greater cost efficiency can be obtained
Ad Hoc Analysis
Ad hoc analysis that can leverage the interconnected data model so as to gain visibility into desired area
TRACKING THE STUDENT LIFECYCLE
Like any other educational institution, Nanyang Technological University (NTU) Singapore is required to provide management reports relating to students’ curriculum and activity — the entire “student lifecycle” on a yearly basis throughout their time at the university. Within four weeks of deploying our Educational Pathway Dashboard and with minimal training, the Admissions Office staff was able to generate the reports they needed. Using our solution, they could quickly and thoroughly analyze admissions statistics and know immediately the status of applications and acceptance, as well as the enrollment at the University.
The reports showed detailed program information for the administrative staff to conduct comparative analysis of these statistics over a span of years and to forecast curricula and staffing requirements.They were also able to track the academic progress and employment status of students after their graduation, e.g. how many continued their graduate studies, how many sought employment and how long it took them to secure their first job.
KNOWLEDGE MANAGEMENT SOLUTIONS PTE LTD
over 1000 analytics projects in the South East Asian region, KMS has consistently delivered clarity into day to day management reporting by integration disparate data elements into a single unified picture.
Our clients include local and foreign Multinationals, public sector and non-profit public enterprise. Within the educational sector, we have developed and deployed pathway based analytical platforms for various tertiary institutions including universities and polytechnics.
“A successful organisation needs a good downstream, with a good process to collect data in the easiest way possible. Singapore Polytechnic emphasises on a culture of good service and efficiency. We measure and monitor ourselves constantly for progress. The business intelligence tool from KMS has given us the foresight to see information ahead, at just a click of a button. This enables us to make better decisions and work more proactively.”
View Full Case Study

Mr Toh Ser Khoon
Deputy Director, Department of Organisation Development